Department of Medicine Inaugural Self-Identification Survey Results (2021)
The Department of Medicine (DoM) launched its first ever Self-identification Survey from Oct - Nov 2021 under the leadership of Faculty Lead, Equity, Dr. Umberin Najeeb (now Vice-Chair, Culture & Inclusion). To encourage participation, the survey was conducted completely anonymously – responses were provided without any personal identifiers, unlinked to academic position description, specialty/division or hospital affiliation. Of over 1500 faculty members we heard back from 562 giving a response rate of 36%.
Here are the highlights of what we learned:
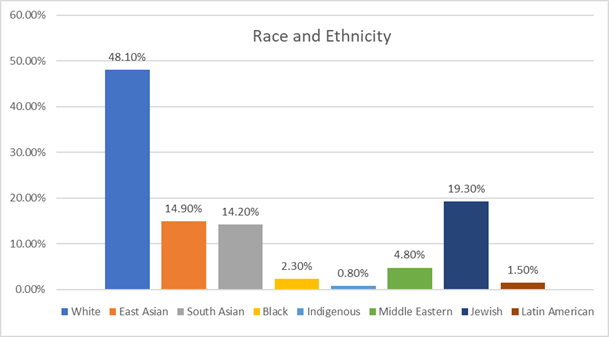
- Of the faculty respondents, less than half (48.1%) self-identified as White. One in five identified as Jewish (19.3%), as East Asian 14.9% and 14.2% as South Asian. Smaller proportions self-identified as other groups, and very few identified as Black (2.3%) or Indigenous (0.9%).
- Compared with Toronto residents in 2016: women, Black, Filipino, and Indigenous peoples are under-represented in our department.
- One-quarter of participants (24.9%) indicated that they were ‘definitely’ or ‘probably’ identifiable as a member of a specific religion based on their appearance/something they wear. Greater accommodation for religion (dietary needs, celebrations, place of worship) would enhance our diversity efforts.
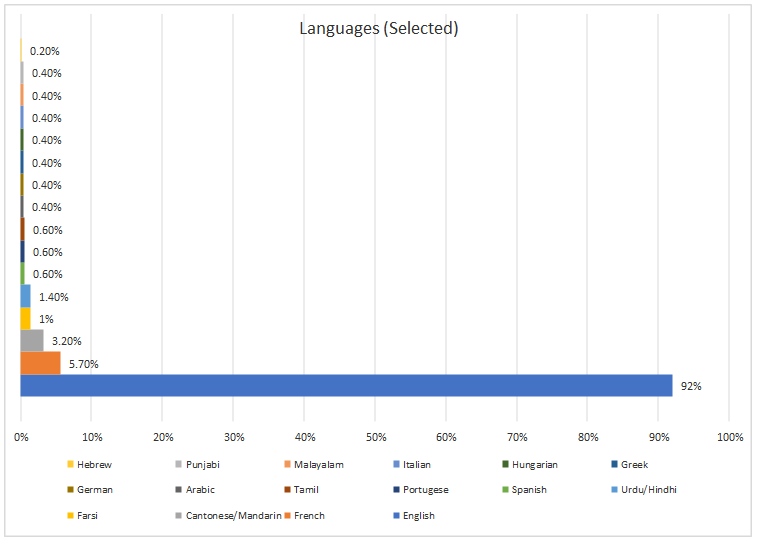
- One-third of our respondents were born outside Canada, 28% completed their medical training outside North America, and our faculty speak more than 31 languages!
- 17.8% identified as having grown up in a low income or lower middle-income family compared with 41.8% who grew up in an upper-middle or upper income environment. Almost one in five identified as having a physician parent.
- Compared with Toronto residents in 2016, people from lower income families are under-represented in our department.
- 43.9% self-identified as women, 52.8% as men, and 1.4% as transgender or non-binary.
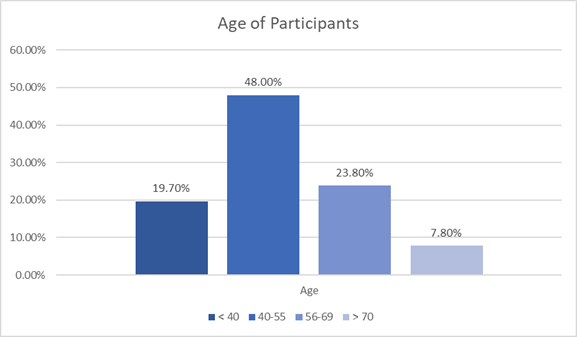
- One in five respondents were ≤ 40 years of age, most were living with others (87.6%) and most were parents (61.6%). Of the 318 with children, 29.2% had toddlers, 44.3% pre-teens, 31.8% teenagers, and 28.3% adult children.
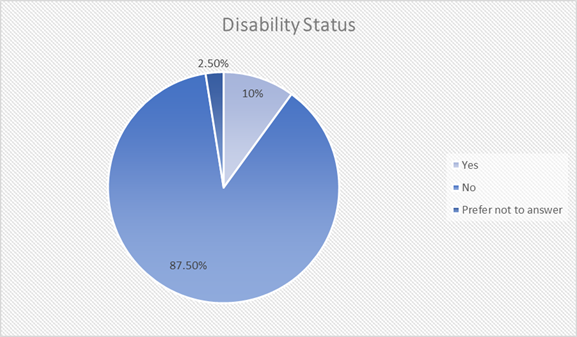
- A significant proportion (22.8%) had caregiver roles for their elderly parents and/or family members. 10% identified as having a disability, the most common being a chronic medical illness. Greater accommodation for caregiver responsibilities would enhance our diversity efforts.
- Participants supported ongoing efforts to increase the representation of diverse perspectives among DoM leadership and in recruitment/selection processes, opportunities for mentorship, sponsorship, and empowerment, and education on implicit and explicit bias. We agree and the DoM continues to support a number of initiatives in these areas. If you would like to get involved, please reach out to dom.cultureandinclusion@utoronto.ca.
Gender Identity: Survey participants included 53% men and 44% women.
Age: 48% faculty members are between 40-55 years with 23.8% between 56-69 years, 19.7 % less than 40 years and 7.8% more then 70 years of age.
Religious affiliation: Survey participants self-identify as following: Christianity -30%, Judaism -21%, Hinduism -6%, Islam - 4.8%, Atheism - 18.8% and no religious affiliation -17%.

Race: 48% of faculty members self-identify as White with 15% as East Asian and 14% as South Asian. 2.3 % of our faculty identified as Black and < 1% as Indigenous.
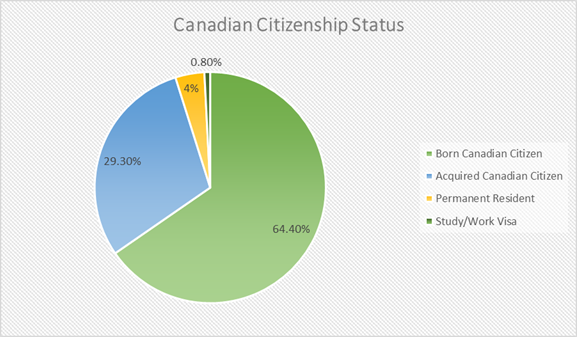
Canadian Citizenship Status: The majority (64.4 %) of survey participants were born Canadian, while 4 % are permanent residents and 29.30 % have acquired Canadian citizenship status.
Disability: 10% of survey participants acknowledged some form of disability.